honolulutraffic.com
offering cost-effective ways to reduce traffic congestion in Honolulu
The environmentally degrading aspect of rail
transit:
- 1. Visual blight of elevated rail lines through the town.
- 2. Noise blight of 79 decibels at 50 feet.
- 3. High energy use (see below).
- 4. Sprawling stations — five stories high, 270 feet long and 50 feet wide (see below and the Aloha Tower station video at
www.honolulutransit.com . - 5. Will create increased traffic congestion in town as supporting pillars take away valuable road space,
which by reducing auto speeds, increases emissions.
Before and after images of "the environmentally preferable alternative":
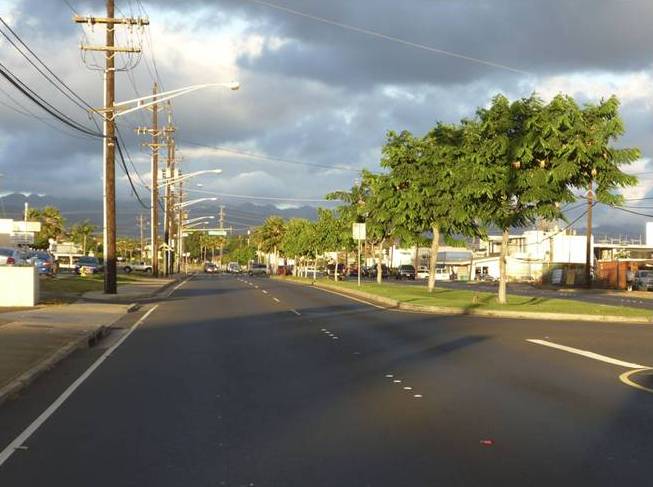
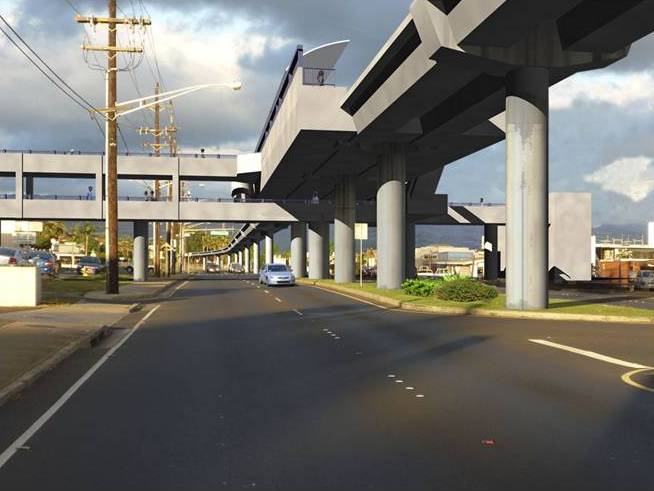
The above images are of the Waipahu rail transit station showing the impact that "the environmentally preferable" rail line will have on Waipahu and, of course, everywhere else.
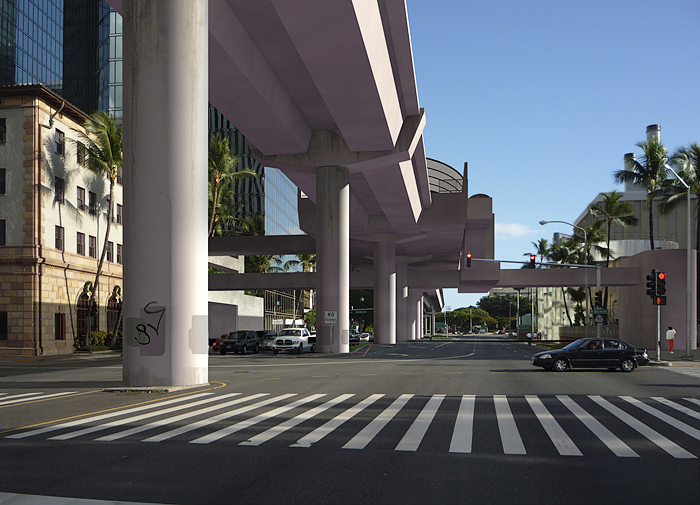
"A Hawaiian Sense of Place" — The Downtown Station:
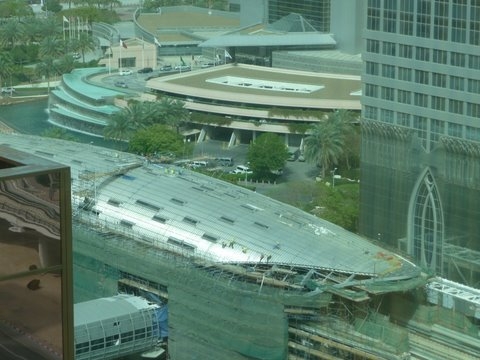
Rail transit stations as "narrow football stadiums":
A few days ago we quoted Kamehameha Schools as likening the City's rail stations to "narrow football fields" and said that they were more like "narrow football stadiums." Yesterday one of our correspondents sent us a series of photos of the Dubai elevated rail line that is now under construction. Lo and behold the "narrow football stadium" turns out to be not as great an exaggeration as some had thought:
Skytrain noise unacceptable said BC Ombudsman:
The Ombudsman for British Columbia wrote three years after SkyTrain began running that, "The negative external effects of Skytrain currently include in some areas unacceptable noise levels, a harsh and forbidding presence, loss of privacy reduced property values and a depreciated enjoyment of individual and community lifestyle. The impact over time of these effects will include a gradual deterioration of the neighbourhoods with associated social and economic costs, a less desirable transportation system, and a loss of public regard for the Skytrain concept."
The Ombudsman's 28-page report is on the BC government website and should be read in full READ MORE
Seattle Times: "Residents rally against light rail noise":
The July 5, 2009, Seattle Time carries the above headline to an article, which should be read in its entirety. Following are some excerpts from it:
"If it were up to her, Sharon Nakata would go spray WD-40 on the Sound Transit light-rail tracks herself.
"She says she just can't take the screeching, tearing, grating sound now grinding past the Tukwila neighborhood where she's lived for more than 60 years. Trains go by about every five minutes, 20 hours a day most days, on elevated tracks 140 feet away, and the noise sounds like fingernails on a chalkboard or a broken wheel on a grocery cart — but much louder — say some residents of the 90 homes located between East Marginal Way and Duwamish Park. And, they say, it's knocking down their property values.
"Sound Transit officials say the screeching noise was unexpected, and they're not sure how they'll fix it — or if they'll fix it at all. The noise level was within the federally approved range during a 2008 test run, and spokesman Bruce Gray says it might be bothering residents because they aren't used to it yet.
"It's not a noise we wanted to get used to," said Jennifer Haynes, who lives on South 116th Street. Haynes and eight other residents met recently and decided to compel Sound Transit to fix the noise."
OUR OPINION: You can listen to the City tell you that the modern light rail being built these days is not noisy or you can check on the facts.
![]() March 21, 2008.
March 21, 2008.
Today's Advertiser editorial is incorrect:
The editorial says that wheel squeal “generally occurs where there are sharp turns — not anything anticipated in the Honolulu alignment.”
That statement is inaccurate. The proposed Honolulu rail line transitions from Halekauwila Street onto Ward Avenue — it is a right angle. It must then transition from Ward onto Waimanu Street — another right angle in a tight space. This was the route in the 1992 plan and any other will mean unacceptable condemnations.
The turn from Kapiolani onto University is about a 70 degree turn and the turn from University Avenue into the University itself is another 90 degree turn. There are other curves in the line of a less squeal-making type as the rail makes its way through town.
Two weeks ago we commissioned Vancouver sound engineers to record the SkyTrain noise. The noise registered 79 Db(A) at 50 feet. They recorded it 50 feet from the line in the Creekside Park area where there is a 65° gradual curve. This appears to be far more gradual than will be the case with many of the in-town line curves in Honolulu. The location and curve is shown here on GOOGLE_MAPS
The Honolulu trains will run from 4:00AM to midnight daily. They will run every 3 minutes during the rush hours, every 6 minutes during the rest of the day and every 10 minutes during the late night hours. With trains in each direction, the intervals between trains will therefore average 1.5 minutes, 3 minutes and 5 minutes respectively. The six recordings are available here.
Renderings by the city and the Architects Association:
Our citizens need to understand some of the more environmentally degrading aspects of rail transit. Using the 1992 plans, which the City has said they would use and bring up to date, the size of the stations are 270 feet long, sprawl over both sides of every street they run on together escalators, elevators and stairs on each side of the street. Station heights vary from 50 to 75 feet above street level depending on the type of station.
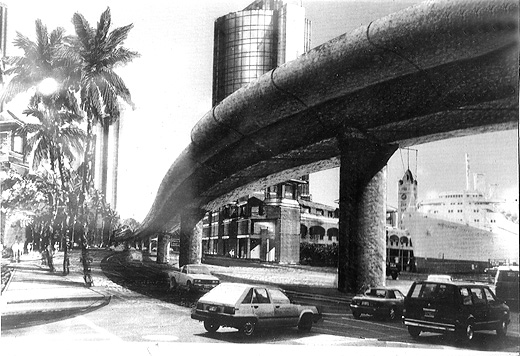
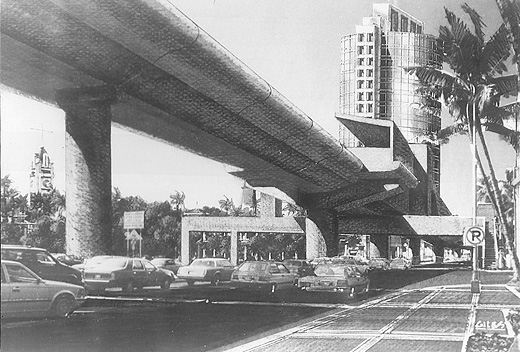
These two renderings above were produced in 1992 by the American Architects Association, Hawaii Chapter, which favored the rail line. The route for the line crosses the foot of Bishop Street, crosses to Halekauwila Street, up Ward Avenue to Waimunu crossing over to Kona Street at Kamakee Street. It goes along Kona on the mauka side of Ala Moana Center, up Atkinson and around the Convention Center onto Kapiolani until it turns up University Avenue and is at 65 feet above University as it goes over the H-1 freeway into UH where is stops at the Quarry station at the same altitude that it reaches in passing over H-1. Average decibel level is 75.
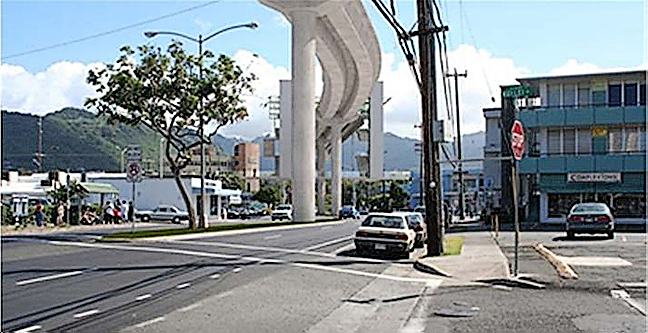
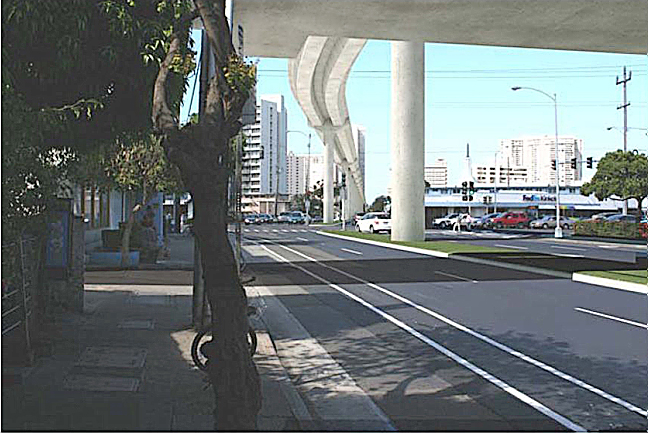
The above photo/rendering produced by the City is the view from University Avenue just makai of King Street looking mauka. The Varsity Theater can been seen just to the left of the rail line.
The above photo/rendering produced by the City is the view from underneath the Varsity Theater Station looking makai towards King Street with Kinko's to the right.
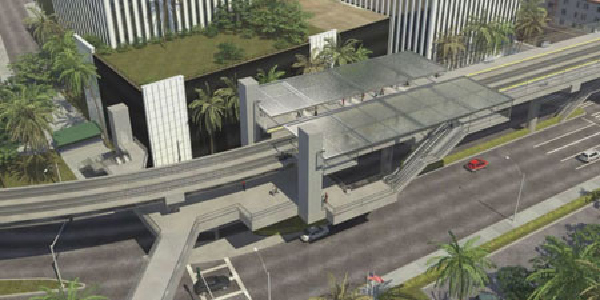
This is a City rendering of the Aloha Tower rail station. It has a great deal of charm and provides a unique Hawaiian sense of place — they say. It will be admired by all those who believe in sustainability — of taxes.
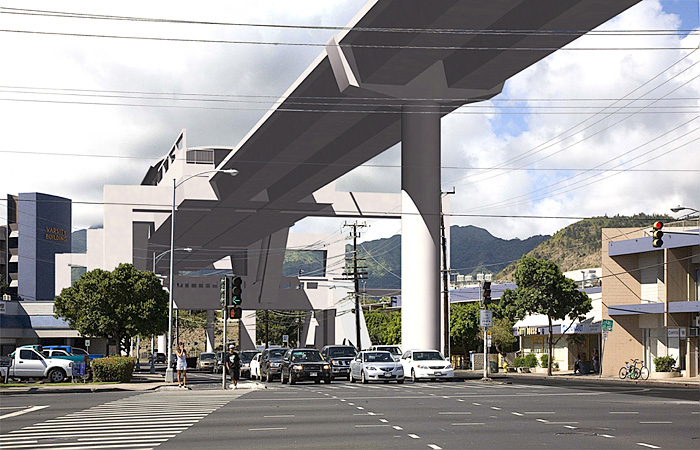
Rendering of the projected rail station at King and University by an unnamed architect.
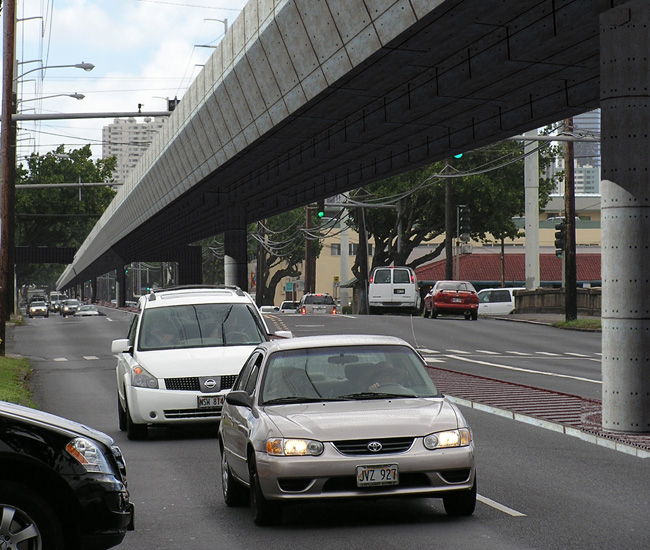
Our artist's rendering of the rail line running along Dillingham Boulevard towards downtown. The artist shows the sound mitigation panels on the sides of the line.
Energy.
Since we do not have the electrical capacity to supply the 60 million kilowatt hours of electricity needed annually for the trains, we will have to build a new generating station. It goes on. For further detail, study the "Final Environmental Impact Statement for the Honolulu Rapid Transit Program, July 1992" and the "Track Plan and Profile Drawings, Appendices A & B," all available at the City's Municipal Library.
The myth of rail's energy savings:
There are two kinds of energy use that should concern us, the operating energy use and the energy used to build the rail transit facility. Both are discussed below:
Operating energy use:
The latest energy data broken down by individual operating units showing Btu's per passenger mile makes it quite clear that the projected Honolulu rail line will use more energy per passenger mile than a regular automobile with its 1.15 average passenger load. A full explanation is given here in an op/ed written for the Honolulu Star-Bulletin.
Below is a chart showing the energy use per passenger mile for automobiles, buses and rail transit from the U.S. Dept. of Energy Transportation Energy Data Book, 2006. pp. 2-13/14.
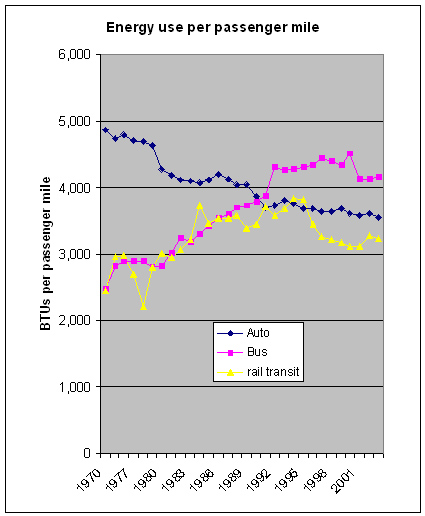 Notice that
automobiles show a steady downward trend in energy use while buses and rail
transit have trended upwards albeit with certain times of decline. Note also
that auto fuel use has declined to where it is now less per passenger mile than
buses while rail transit is only nine percent less than autos.
Notice that
automobiles show a steady downward trend in energy use while buses and rail
transit have trended upwards albeit with certain times of decline. Note also
that auto fuel use has declined to where it is now less per passenger mile than
buses while rail transit is only nine percent less than autos.
With the advent of hybrid cars and buses we may expect autos and buses to continue to decline while rail transit will stay fairly flat. It is therefore only a matter of time before automobiles will use less energy per passenger mile than rail transit.
While the trend for vanpools is not given, the data show that energy use by vanpools is 1,400 BTUs per passenger mile, or 60 percent less than rail transit.
Some may find these data counter-intuitive especially listening to all the hype in the media. However, except within dense urban centers, trains trend to run empty on the runs back out to the suburbs, and run all day regardless of demand.
Undoubtedly, a full train uses less energy per passenger than a single-occupant vehicle (SOV), however, that is not how they are operated.
On the other hand, autos and vanpools travel from their point of origin to their destination and park. They do not run around aimlessly as if costs (or energy) do not matter.
![]() December 13, 2007.
December 13, 2007.
Demographia: Public transportation is not so green:
|
Greenhouse Gas Emissions |
|
|
in grams per passenger mile |
|
| Public transport Avg. | 233 |
| PT New York | 133 |
| PT Outside NY | 303 |
| Toyota Prius | 147 |
| Hybrid diesel | 101 |
| SUVs | 443 |
| Avg. 2006 car | 307 |
| Source: Demographia, 9/2007. | |
We ran a story on November 13 about how the energy efficient New York subways, which carry 57 percent of the nation's rail transit traffic, masks the energy inefficiency of most other rail lines. Up to now we have given a free pass to new rail lines as being more energy efficient than autos per passenger mile. However, that is all now in doubt as many of the suburban oriented rail lines turn out to use far more energy per passenger mile than autos.
Now we find, courtesy of Wendell Cox's Demographia website, that the same principle applies to greenhouse gas emissions, . It turns out that New York subways have very low GG emissions per passenger mile and again that masks the high amounts emitted by those transit lines outside of New York. What is most interesting is the very low ratings for the new hybrid diesel cars now being introduced in Europe. READ MORE
The average light rail line uses more energy than autos:
The chart below from the U.S. Dept. of Energy confirms similar data we have published before but shows it graphically. Bear in mind that the average energy use of automobiles, as actually used in practice with a typical 1.15 people per car, is 3400 Btus per passenger mile according to the U.S. Dept. of Energy. For confirmation see the 2007 DOE Energy Data Book. Table 2.13. The City has its work cut out to persuade us that light rail is more energy efficient than our automobiles.
Fact #221: June 17, 2002, Transit Rail Energy Intensity Varies By System
Because of the inherent differences in the nature of services, routes available, and many additional factors, the energy intensity of transit rail systems can vary substantially among systems. The charts below show that for 2000, light rail systems varied from 1,600 Btu per passenger-mile to over 8,000 Btu per passenger-mile; energy intensity for heavy rail systems ranged from 2,200 to 6,200 Btu per passenger-mile. Available here.
Supporting Information
| City, State | Btu per passenger-mile |
|---|---|
| Cleveland, OH | 8,250 |
| Pittsburgh, PA | 7,526 |
| San Jose, CA | 7,035 |
| Buffalo, NY | 6,839 |
| San Francisco, CA | 6,591 |
| Dallas, TX | 5,935 |
| Philadelphia, PA | 5,828 |
| Baltimore, MD | 5,508 |
| Seattle, WA | 5,383 |
| Sacramento, CA | 4,368 |
| Boston, MA | 3,878 |
| Denver, CO | 3,612 |
| Portland, OR | 2,927 |
| Los Angeles, CA | 2,621 |
| New Orleans, LA | 2,594 |
| St. Louis, MO | 2,366 |
| San Diego, CA | 2,337 |
| Salt Lake City, UT | 1,970 |
| Newark, NJ | 1,597 |
| City, State | Btu per passenger-mile |
|---|---|
| Cleveland, OH | 6,173 |
| Lindenwold, NJ | 5,027 |
| Miami, FL | 4,928 |
| Boston, MA | 4,464 |
| Chicago, IL | 4,205 |
| Philadelphia, PA | 4,001 |
| Baltimore, MD | 3,845 |
| Washington, DC | 3,761 |
| New York, NY | 3,388 |
| Oakland, CA | 2,745 |
| Brooklyn, NY | 2,482 |
| Atlanta, GA | 2,249 |
|
Source: Federal Transit Administration, 2000 National Transit Database. |
|
Construction energy use:
CBO
TESTIMONY
STATEMENT
OF
ALICE M. RIVLIN DIRECTOR CONGRESSIONAL BUDGET OFFICE
Before the Subcommittee on Transportation Committee on the Environment and Public Works United States Senate on October 5, 1977
Excerpt: "In particular, new heavy rail systems appear much less energy-efficient than new bus services, when the energy needed to build roadways and track, the energy needed to manufacture and maintain vehicles, the energy used to heat and light stations, the energy required to drive to stations, and the directness of alternative modes of travel are taken into consideration. The principal reason for this is that the limited route mileage of rail systems necessitates a high degree of auto travel to and from stations, resulting in overall, door-to-door travel patterns that are less energy-efficient than rail travel by itself. As illustrated in Figure 2, a typical trip on a new heavy rail system requires about twice as much energy per mile as does a typical trip by bus, all things considered. Old heavy rail systems, located in concentrated urban areas where stations are easily reached by foot and by bus, rank only slightly behind bus in terms of their modal energy requirements. Vanpools use the least energy, whereas single-occupant automobiles and dial-a-ride service use the most.
In computing the energy savings of new programs, it is necessary to go one more step: since most of the passengers on a new service formerly made comparable trips by some other mode, the energy savings associated with these shifts in travel behavior must take into account the fuel efficiency of the former mode of travel as well as that of the new mode. Experience across the country indicates that patronage on new public transport services is more apt to be drawn from existing public transport services and from carpools. As a result, the net savings in energy can be surprisingly small or even negative. Our findings, which are illustrated in Figure 3, show that a typical trip on a new heavy rail system actually requires more energy than before, while new trips by bus, carpool, and vanpool show substantial energy savings per passenger mile."
The last word on highways and "induced travel":
One of the issues that stops highway improvements is the idea that adding highways induces new automobile trips (as much as a 10 percent increase in highway capacity inducing a 9 percent increase in traffic) thus nullifying the highway investment. Robert Cervero, Professor of Urban and Regional Planning at UC-Berkeley, has revisited the issue and concludes that earlier studies had significantly overestimated the inducement effect and that it is closer to a 10 increase in highways inducing a 4 percent increase in traffic. As he puts it, "Road investments by themselves do not increase volumes. Only by conferring a benefit, like faster speeds, will traffic increase. Adding a twelve-foot lane along a congested urban corridor matters; adding one in a lightly trafficked exurban stretch does not." He concludes, "Although I personally sympathize with the aims of many environmentalists, fighting highway projects, regardless what benefit-cost numbers say, is misguided. The problems people associate with roads—e.g., congestion and air pollution—are not the fault of road investments per se. These problems stem from the use and mispricing of roads, new and old alike. They also stem from the absence of careful land use planning and management around new interchanges and along newly expanded highways. Better road pricing and land use planning are more likely to achieve the aims of environmentalists than carte blanche bans on any and all road construction."READ MORE
Rail transit stations as "narrow football stadiums":
A few days ago we quoted Kamehameha Schools as likening the City's rail stations to "narrow football fields" and said that they were more like "narrow football stadiums." Yesterday one of our correspondents sent us a series of photos of the Dubai elevated rail line that is now under construction. Lo and behold the "narrow football stadium" turns out to be not as great an exaggeration as some had thought:
New artist's rendering of HOT lanes with TheBus and TheVanpool:
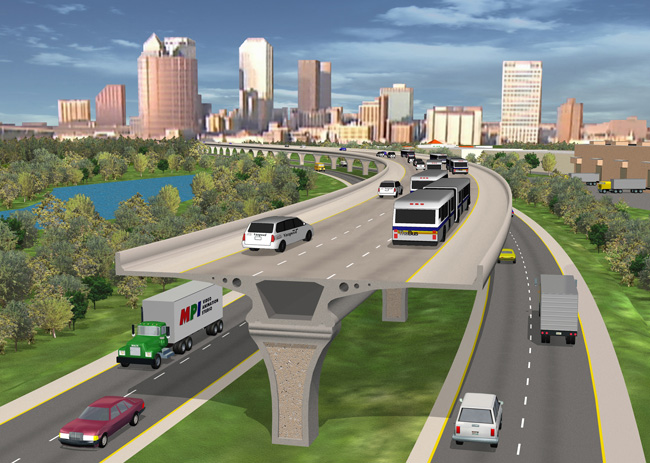
Buses and vanpools go free on the HOT lanes alternative and have priority. Into town on the Express Bus at 60 mph is the best thing we could do for public transportation. And HOT lanes is certainly the best thing we could do for traffic congestion. And the HOT lanes would only operate in industrial and business areas; it would stay out of all residential areas.