honolulutraffic.com
formerly The Alliance for Traffic Improvement
Seeking cost effective ways to reduce traffic congestion on Oahu


The myths about rail
transit for Honolulu
Myth #1 — “
First,
no one is proposing ‘light’ rail for
Light
rail runs in the street for a significant part of its route and takes its power
from overhead as in
Heavy
rail is totally separated from the street and takes its power from below — the
proverbial third rail — as in New York, Washington DC and Miami.
Heavy
rail is what is being proposed for
Myth # 2 — "We're too big a city
not to
have rail transit."
Using the term ‘cities’ is very
misleading. For example, as a city,
The federal government’s term to
describe such an urban area is Metropolitan Statistical Area — MSA’s or metro
area’s — they do not use cities.
The smallest metro area with an
elevated rail line of the kind being proposed for
View the top 60 MSAs in the
U.S. Review this list and note that of the 55 metro areas larger than us, most
do not have rail lines. If we were to build a rail transit line, we would be
the smallest metro area in the U.S. with one.
Myth # 3 — "Rail will take cars off the road."
The
decennial U.S. Census shows that there is a continuing decline in the percentage
of commuters using public transportation in virtually all U.S. cities — regardless
of whether they have rail transit or not; public transportation commuting has
declined from 12 percent in 1960 to 4.7 percent in 2000. In
|
All U.S. Census Data for journey-to-work,
1960-2000 | |||||
|
|
|
|
|
|
|
|
Percent of Workers by Mode |
1960 |
1970 |
1980 |
1990 |
2000 |
|
Private Vehicle |
64.0 |
77.7 |
84.1 |
86.5 |
87.9 |
|
Public transportation |
12.1 |
8.9 |
6.4 |
5.3 |
4.7 |
|
Walked |
9.9 |
7.4 |
5.6 |
3.9 |
2.9 |
|
Other means |
6.8 |
2.5 |
1.6 |
1.3 |
1.2 |
|
Worked at home |
7.2 |
3.5 |
2.3 |
3.0 |
3.3 |
Just
in the last ten years the 2000 Census data shows that the nation had 13 million
more drivers than in 1990, and 2 thousand fewer commuters using public
transportation. See Census details.
Secondly,
even if the nation’s metro areas were able to halt this slide and maintain the
same percentage of public transportation use, the growth in population and thus
people driving to work would still totally overwhelm public transportation.
Let’s
put this in
Here’s
some examples for individual metro areas for the past ten years: Washington DC had
35 thousand fewer commuters using public transportation in 2000 than in 1990, but
had 317,000 more drivers; Portland: 22,000 more transit users and 173,000 more
drivers.
Here’s the Census journey-to-work data for the top 49 metro areas.
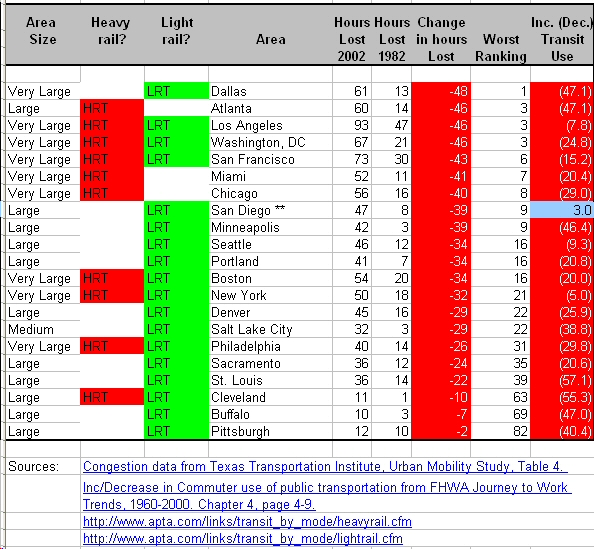
The following table shows all the metro areas with rail sorted according to greatest increases in traffic congestion ("Change in hours lost") 1982-2002, together with their ranking. The last column shows the Increase/(Decrease) in the percentage of commuters using public transportation. Thus, for example, Honolulu in 1980 had 10 percent of its commuters using public transportation and that dropped to 8.3 percent in 2000, a decline of (17.0) percent.
Myth # 4 — "Rail transit will mean less traffic
."
The recognized national authority
on traffic congestion is the Texas Transportation Institute (TTI) at
Their latest annual report on
traffic congestion nationally divided the nation’s metro area’s into four population
size categories SEE LIST as follows:
·
· In the ‘Very Large’ category of over 3 million in population, there
were 11 metro areas, all of which had rail lines — except
·
· In the ‘Large’ category of 1 to 3 million in population, there
were 27 metro areas of which half had rail lines. Excepting the stable or
shrinking metro areas of Cleveland, New Orleans, Buffalo, and Pittsburgh, the
best performing metro areas for traffic congestion were Milwaukee, Norfolk,
Kansas City, and Oklahoma City — and none of these had rail.
·
· In the ‘Medium’ category of half a million to one million
population there were 30 metro areas, which included Honolulu, and of these,
only Salt Lake City, which is 50 percent larger than us, had a rail line (a
real ‘light’ rail line), and they had the third worst showing in traffic
congestion increases.
·
· In the 'Small' category of less than half a million, there were no
metro areas with rail lines.
TTI’s latest annual tracking report on traffic
congestion said that the nation would have to expand transit system ridership
by 33 percent each year to maintain congestion levels and they added, quote, “It
may be very difficult to convince this many persons to begin riding transit.” READ THEIR FULL STATEMENT
Myth # 5 — "Rapid transit is faster than
highways."
You
often hear that ‘light’ rail will ‘whoosh,’ or ‘whisk,’ you into town. However,
the trains on the rail line projected for
On
the other hand, HOT lanes are uncongested highways and will move traffic at
55-60mph.
Myth # 6 — "Rail transit equals 12 lanes of
freeway ."
A single lane
of freeway has a three times greater capacity than is carried, in practice, by the
nation’s busiest rail line,
Here’s why: A
single lane dedicated to buses has the capacity to carry 1,500 buses an hour
with 75 passengers each or 112,000 people peak direction per hour. But that is
just theoretical capacity, and is as meaningless as those statements rail
proponents make discussing rail capacity.
The fact is
that, in practice, neither a rail line, nor HOT lanes, could possibly use all
the capacity available to it. But, in practice, HOV lanes generally carry far
more riders per hour than do rail lines of any kind. Only
Example,
Myth # 7 — "There is no room for new highways
."
The reversible HOTway being
proposed by the us at Honolulutraffic.com would be elevated and run in
the same alignment as the proposed rail transit line and be only a few feet
wider. Therefore, any objections about “no room,” or on other environmental grounds,
will apply equally to both the rail transit line and the HOT lanes.

Both rail and
HOTway would offer far more capacity for high-occupancy vehicles than could be
used. The HOT lanes, however, would cost far less and get bus riders, vanpool
riders and toll-paying motorists downtown much faster.
Myth # 8 — "Honolulu
has the right density for rail. "
Population density.
One of the statements that
rail proponents make is that
“Population density is equally important than pure
population as a determinant of the potential for rail transit ridership. As
reported in the 2000 census, the population density for the entire
If you examine the data they are
using you find that while they correct about the number, it is not one
you can use. For example, if you look at the first table below, you will note
that
|
MSA (metro area) |
Area in sq. miles |
Population |
Density |
|
|
600 |
876,156 |
1461 |
|
|
39,369 |
1,563,282 |
40 |
There is another way to judge available Census density data,
other than metro area and that is “Central city
only.” When we do that the results appear to be in line with what one
would expect as in the table below:
|
Central city only |
Area in sq. miles |
Population |
Density |
|
|
96 |
371,657 |
4337 |
|
|
113 |
478,434 |
4,222 |
An interesting way to look at this “Central city only” data is to assemble it for the top 49 metro areas, and then add Honolulu[i] and then sort these areas in descending order of population density. Click here for the result.
Any group of ten contiguous metro areas in the list shows a
remarkable diversity in the use of public transportation for commuting. For
example,
The average of these ten metro areas is less than the next higher ten metro areas in the table which have a range of 2.0 to 24.9 percent. The ten metro areas below the Honolulu Ten in the table have a range of 0.8 percent to 5.7 percent. And so on.
This teaches us that while there is, on average, a correlation between aggregations of central city densities and public transportation use, it is not useful as a predictive tool for any one area.
Footnotes:
[i] The journey-to-work data for the six cities
larger than
Myth #9: New roads will not improve traffic congestion:
“The congestion is not going to be solved by building new roads,” says [Hawaii DOT's Brennon] Morioka. “The more roads you build, the more you encourage people to drive. There needs to be other programs and incentives for people to get out of their cars.”
We could not disagree with Brennon more.
This is a myth that government officials and
environmentalists keep repeating: Of course they do not bother to think through such a
statement. F
The fact is that if you add highway space to relatively
uncongested c
But what will induce them to join it is that the new space reduces traffic congestion somewhat despite inducing some new drivers to come onto the expanded highway space.
Here’s what the
Texas Transp